SAT Score
Are you planning to take the SAT soon? If so, you may be wondering what your SAT score means and how it is calculated. Understanding the scoring system can help you determine your strengths and weaknesses, set realistic goals, and prepare for the exam more effectively. In this post, we will provide an overview of the SAT score and explain how it is calculated step by step. From Raw Scores to Scaled Scores, we’ll give you all the details you need to know to decipher your SAT score. Whether you’re a high school student, a parent, or an educator, read on to learn everything you need to know about SAT scoring.
Table of Contents
SAT Score Overview
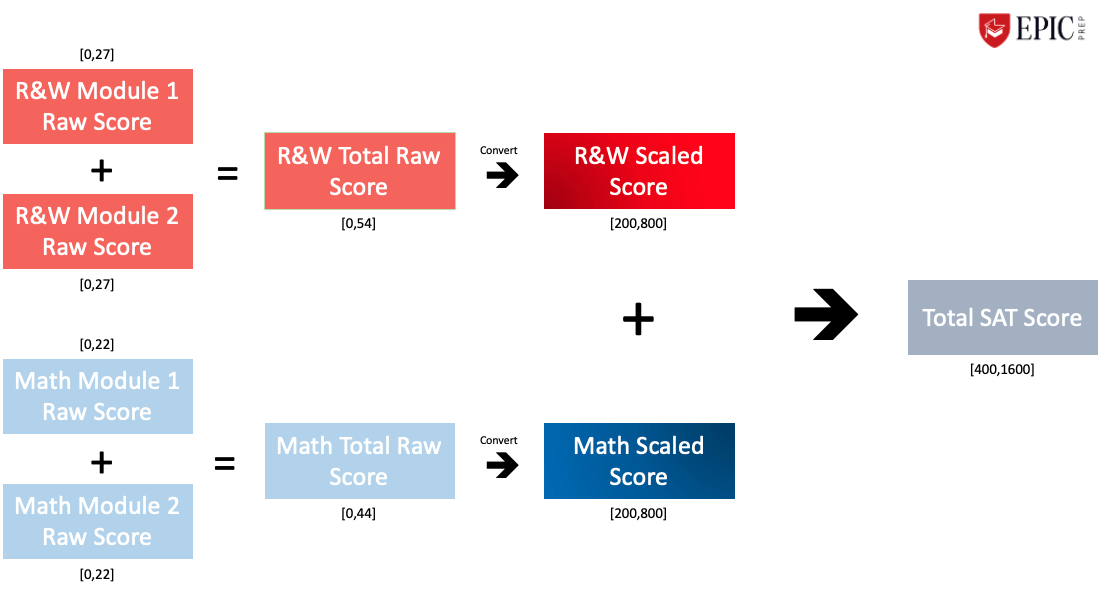
The SAT (both paper and digital) is scored on a scale of 400 to 1600, with 200 to 800 points possible for each of the two main sections: Mathematics and Reading & Writing. Scores for each section are based on the number of questions answered correctly, with no penalty for incorrect answers. This means that it is better to guess than to leave a question blank.
The Mathematics and Reading & Writing sections are scored separately on a scale of 200 to 800. The Raw Score for each section is calculated by adding the number of questions answered correctly in each of the modules in the section. The Raw Score is then converted to a Scaled Score using a conversion table that takes into account the difficulty of the questions. To calculate your final SAT score, the scores from the Mathematics and Reading & Writing sections are added.
Step 1: Get your Raw Score
To obtain your Raw Score, add the following:
- Your total Reading & Writing section score
- Your total score for the Mathematics section.
In both cases, remember that each question counts as one point for the calculation of the Raw Score. We leave you a table with the structure of both sections of the SAT so that you better understand your potential maximum raw score.
Digital SAT Module Breakdown
| Section | Module 1 | Module 2 | ||
| Reading and Writing | 27 questions | 27 questions | ||
| Math | 22 questions | 22 questions | ||
| Raw Score | Reading and Writing Score | Math Test Score | ||
| # Of Correct Answers | Lower | Upper | Lower | Upper |
| 0 | 200 | 200 | 200 | 200 |
| 1 | 200 | 200 | 200 | 200 |
| 2 | 200 | 200 | 200 | 200 |
| 3 | 200 | 200 | 200 | 200 |
| 4 | 200 | 200 | 200 | 200 |
| 5 | 200 | 200 | 200 | 200 |
| 6 | 200 | 200 | 200 | 200 |
| 7 | 200 | 210 | 200 | 220 |
| 8 | 200 | 220 | 200 | 230 |
| 9 | 210 | 230 | 220 | 250 |
| 10 | 230 | 250 | 250 | 280 |
| 11 | 240 | 260 | 280 | 310 |
| 12 | 250 | 270 | 290 | 320 |
| 13 | 260 | 280 | 300 | 330 |
| 14 | 280 | 300 | 310 | 340 |
| 15 | 290 | 310 | 320 | 350 |
| 16 | 320 | 340 | 330 | 360 |
| 17 | 340 | 360 | 330 | 360 |
| 18 | 350 | 370 | 340 | 370 |
| 19 | 360 | 380 | 350 | 380 |
| 20 | 370 | 390 | 360 | 390 |
| 21 | 370 | 390 | 370 | 400 |
| 22 | 380 | 400 | 370 | 400 |
| 23 | 390 | 410 | 380 | 410 |
| 24 | 400 | 420 | 390 | 420 |
| 25 | 410 | 430 | 400 | 430 |
| 26 | 420 | 440 | 420 | 450 |
| 27 | 420 | 440 | 430 | 460 |
| 28 | 430 | 450 | 440 | 470 |
| 29 | 440 | 460 | 460 | 490 |
| 30 | 450 | 470 | 470 | 500 |
| 31 | 460 | 480 | 480 | 510 |
| 32 | 460 | 480 | 500 | 530 |
| 33 | 470 | 490 | 510 | 540 |
| 34 | 480 | 500 | 520 | 550 |
| 35 | 490 | 510 | 530 | 560 |
| 36 | 490 | 510 | 550 | 580 |
| 37 | 500 | 520 | 560 | 590 |
| 38 | 510 | 530 | 570 | 600 |
| 39 | 520 | 540 | 580 | 610 |
| 40 | 530 | 550 | 590 | 620 |
| 41 | 540 | 560 | 600 | 630 |
| 42 | 540 | 560 | 620 | 650 |
| 43 | 550 | 570 | 630 | 660 |
| 44 | 560 | 580 | 650 | 680 |
| 45 | 570 | 590 | 670 | 700 |
| 46 | 580 | 600 | 690 | 720 |
| 47 | 590 | 610 | 710 | 740 |
| 48 | 590 | 610 | 730 | 760 |
| 49 | 600 | 620 | 740 | 770 |
| 50 | 610 | 630 | 750 | 780 |
| 51 | 620 | 640 | 760 | 790 |
| 52 | 630 | 650 | 770 | 800 |
| 53 | 630 | 650 | 780 | 800 |
| 54 | 640 | 660 | 790 | 800 |
| 55 | 650 | 670 | ||
| 56 | 660 | 680 | ||
| 57 | 670 | 690 | ||
| 58 | 680 | 700 | ||
| 59 | 690 | 710 | ||
| 60 | 700 | 720 | ||
| 61 | 710 | 730 | ||
| 62 | 720 | 740 | ||
| 63 | 730 | 750 | ||
| 64 | 750 | 770 | ||
| 65 | 770 | 790 | ||
| 66 | 790 | 800 | ||
Example Continuation:
- Your Reading and Writing Raw Score is 51. By applying the conversion table above, the Reading and Writing Scaled Score is 640 (Remember to apply it to the upper scale).
- Your Mathematics Raw Score is 39. By applying the conversion table above, the Mathematics Scaled Score is 610 (Remember to apply it to the upper scale).
Step 3: Add both Scaled Scores
To complete the process and obtain your final SAT score, you need to add both scaled scores.
Last Step of the Example:
- 640 (Reading and Writing Scaled Score) + 610 (Mathematics Scaled Score) = 1250 points
A good SAT score
It is important to keep in mind that a good SAT score varies depending on the colleges you apply to. However, a score of 1200 or higher is generally considered a good score, while a score of 1400 or higher is considered an excellent score.
For a better understanding of good and bad scores, we have created two tables for you. The first reveals the average SAT score between 2017 and 2022, and the second provides the SAT score range required by the 23 most popular colleges in the United States.
Average SAT Scores (2017-2022) – Collegeboard data
| Year | Average Score: Overall | Average Score: Reading & Writing | Average Score: Math |
|---|---|---|---|
| 2017 | 1060 | 533 | 527 |
| 2018 | 1067 | 536 | 531 |
| 2019 | 1059 | 531 | 528 |
| 2020 | 1051 | 528 | 523 |
| 2021 | 1061 | 533 | 528 |
| 2022 | 1050 | 529 | 521 |
SAT Score Range by University (source: niche.com)
| University | SAT Score Range (2022) |
|---|---|
| Harvard University | 1460-1580 |
| Stanford University | 1420-1570 |
| Massachusetts Institute of Technology (MIT) | 1510-1580 |
| Columbia University | 1460-1570 |
| Princeton University | 1450-1570 |
| Yale University | 1460-1580 |
| New York University (NYU) | 1370-1540 |
| University of Texas (UT Austin) | 1210-1470 |
| University of North Carolina at Chapel Hill | 1280-1490 |
| California Institute of Technology (Cal Tech) | 1530-1580 |
| University of Pennsylvania | 1460-1570 |
| Duke University | 1470-1570 |
| John Hopkins University | 1470-1560 |
| University of Michigan (Ann-Arbor) | 1340-1520 |
| University of California – Berkeley | 1310-1530 |
| Georgia Institute of Technology | 1370-1530 |
| Georgetown University | 1370-1530 |
| Boston University | 1310-1500 |
| University of Chicago | 1500-1570 |
| Northwestern University | 1430-1550 |
| Vanderbilt University | 1470-1570 |
| University of Florida | 1290-1460 |
| The Ohio State University | 1210-1430 |
Understanding SAT Percentiles
When a student receives their percentile, they are shown what percentage of students scored the same or lower than theirs. For example, if a student is in the 90th percentile, it means that 90% of their comparison group scored at or below their score. Percentiles assign and rank relative to all other students who took the exam. Universities use percentiles to compare your performance with that of other applicants. If you are applying to a very competitive college, check your score and also your percentile. It’s a good reference to understand how much better you did than others. Keep this metric in mind when making decisions about your applications.
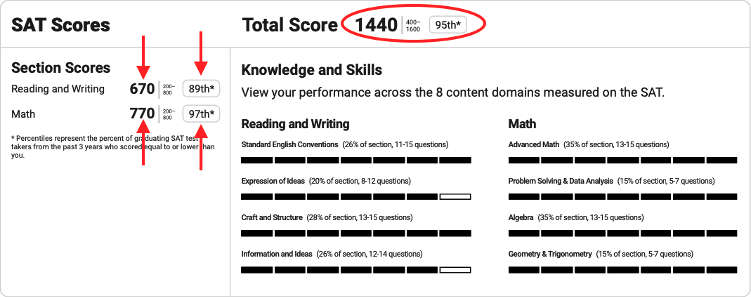
What is the Digital SAT Score Report Like?
Here you have a sample of the SAT digital score report. Note that the arrows point to the performance of the sections (points and percentile) and the circle contains the total performance (points and percentile). This exact information is what you will receive after taking the digital SAT.
Other articles of your interest
Where can we take you?
We have been helping our students access the most prestigious universities worlwide. Check out where our students have been accepted to


CONTACT

SAT® is a registered trademark of the College Board, which is not affiliated with or endorsed by this site.
Zurich
- 41 44 499 00 81
- Kreuzplatz 2, 8032 Zurich, Switzerland
Madrid
- 910 052 566
- Paseo de la Castellana 40, 8ºp 28046 Madrid, España
Barcelona
- 933 803 049
- Via Augusta 29, 6ª Planta 08006 Barcelona, España
Milan
- 39 02 81273 532
- Via Vincenzo Monti 8, 1st floor 20123 Milano, Italy
Zurich
- 41 44 499 00 81
- Kreuzplatz 2, 8032 Zurich, Switzerland
Madrid
- 910 052 566
- Paseo de la Castellana 40, 8ºp 28046 Madrid, España
Barcelona
- 933 803 049
- Via Augusta 29, 6ª Planta 08006 Barcelona, España
Milan
- 39 02 81273 532
- Via Vincenzo Monti 8, 1st floor 20123 Milano, Italy
SAT® is a registered trademark of the College Board, which is not affiliated with or endorsed by this site.