SAT score: scale, calculation and percentiles
Understanding your SAT score means understanding three things: how it’s calculated – on a scale of 400 to 1,600 points -, where that number ranks against the rest of the world’s students, and what score you need for the colleges you have in mind. This guide explains all three, step by step.
Table of contents
How is the SAT score calculated?
The SAT is scored on a scale of 400 to 1,600 points, divided into two sections of 200 to 800 each: Math and Reading & Writing. To arrive at that final score the process has three steps: get your Raw Score, convert it to Scaled Score and add both sections together.
A fact that many students are unaware of: there is no penalty for incorrect answers. It is always better to mark an answer, even if you are not sure, than to leave the question blank.
** Scaled Score: score adjusted for difficulty using the College Board's adaptive algorithm (Bluebook).
Step 1: obtain your Raw Score
Your Raw Score is the total number of correct answers in each section. Each question is worth one point – no discounts for errors.
The digital SAT is divided into adaptive modules. To calculate the Raw Score for each section, you add together the scores from Module 1 and Module 2. Here is the current structure of the test:
| Section | Module | Questions |
|---|---|---|
| Reading and Writing | Module 1 | 27 questions |
| Module 2 | 27 questions | |
| Mathematics | Module 1 | 22 questions |
| Module 2 | 22 questions |
Example:
Reading & Writing:
Module 1: 24 correct out of 27 → 24 points
Module 2 (Superior, assigned by your good result in Module 1): 23 correct out of 27 → 23 points
Raw Score R&W = 24 + 23 = 47
Mathematics:
Module 1: 20 correct out of 22 → 20 points
Module 2 (Upper): 17 correct out of 22 → 17 points
Raw Score Mathematics = 20 + 17 = 37
Call us and find out why our students have been achieving their goals since 2010.
Step 2: From Raw Score to Scaled Score
Once you get the 2 Raw Scores (Reading & Writing and Math), they must be converted into Scaled Scores. To do this, the Bluebook algorithm makes different adjustments and scores the questions differently depending on whether they are in Module 1 or 2, and whether you solved Module 2 easier (Lower) or harder (Higher). College Board has not published the exact details of the fitting algorithm, but we can give you some conclusions drawn from solving – our team and students – the same Bluebook test several times:- All questions within the same Module have the same value for the calculation of the Scaled Score.
- In the Scaled Score calculation, the value of a question in Module 1 is not the same as in Module 2, even though both Modules have the same number of questions.
- The Scaled Score varies for the same Raw Score depending on whether Module 2 is easy (Lower) or difficult (Upper). The Scaled Score of the section is higher for the same Raw Score if Module 2 difficult (Upper) is solved.
Step 3: add both Scaled Scores
Your final SAT score is the sum of the two Scaled Scores: Reading & Writing and Math.
Following the example:
Raw Score R&W = 47 – Raw Score Math = 37
Suppose that, after applying the Bluebook conversion algorithm, the Reading & Writing Scaled Score is 640 and the Math Scaled Score is 610.
640 + 610 = 1,250 points.
Important note: the scaled scores in the example are indicative. College Board does not publish the details of its conversion algorithm, and the process is dynamic – the exact values vary for each test depending on its difficulty. What is fixed is the final scale: always between 400 and 1,600 points.
What is considered a good SAT score?
The answer depends directly on the universities to which you want to apply. However, there are three reference ranges that are worth knowing:
- 1,200: a score that opens doors to a number of universities around the world.
- 1,400: a score that gives access to the majority of university programs and institutions worldwide.
- 1,500 or above: historically associated with the 99th percentile, this is the threshold that puts a student on the radar of the world’s most prestigious institutions – Ivy League, Stanford, MIT and equivalents.
That’s why we always recommend defining your college goal first and working backwards from there: the score you need is not the same if you are aiming for a state university as if you have Harvard or Bocconi in mind.
If your current score is below your goal, at EPIC Prep we design customized preparation plans to help you improve your SAT score in a structured way. Check out our SAT course and we’ll explain how we work.
Below you will find two reference tables: the evolution of the average SAT score between 2017 and 2022, and the rankings required by 23 of the most popular U.S. colleges.
| Year | Average Score Reading & Writing |
Average Score Mathematics |
Score Average SAT |
|---|---|---|---|
| 2022 | 529 | 521 | 1050 |
| 2021 | 533 | 528 | 1060 |
| 2020 | 528 | 523 | 1051 |
| 2019 | 531 | 528 | 1059 |
| 2018 | 536 | 531 | 1068 |
| 2017 | 533 | 527 | 1060 |
Source: College Board
| Institution | SAT 2022 Rank |
|---|---|
| Harvard University | 1460-1580 |
| Stanford University | 1420-1570 |
| Massachusetts Institute of Technology (MIT) | 1510-1580 |
| Columbia University | 1460-1570 |
| Princeton University | 1450-1570 |
| Yale University | 1460-1580 |
| New York University (NYU) | 1370-1540 |
| University of Texas (Austin) | 1210-1470 |
| University of North Carolina at Chapel Hill | 1280-1490 |
| California Institute of Technology (Cal Tech) | 1530-1580 |
| University of Pennsylvania | 1460-1570 |
| Duke University | 1470-1570 |
| Johns Hopkins University | 1470-1560 |
| University of Michigan (Ann Arbor) | 1340-1520 |
| University of California - Berkeley | 1310-1530 |
| Georgia Institute of Technology | 1370-1530 |
| Georgetown University | 1370-1530 |
| Boston University | 1310-1500 |
| University of Chicago | 1500-1570 |
| Northwestern University | 1430-1550 |
| Vanderbilt University | 1470-1570 |
| University of Florida | 1290-1460 |
| The Ohio State University | 1210-1430 |
Source: niche.com
Call us and find out why our students have been achieving their goals since 2010.
How do the SAT percentiles work?
The SAT percentile indicates what percentage of students scored at or below your score. If you are in the 90th percentile, it means that you outperformed 90% of all students who took the test.
To which percentile does each score correspond?
These are the three reference ranges and their approximate percentiles based on historical College Board data:
- 1,200 → 74th percentile. You outperform almost three-quarters of the examinees.
- 1,400 → 93-94 percentile. You are above the 93% of students who took the SAT.
- 1,500 or more → 99th percentile. Historically, this threshold places you among the top 1% of global performers.
These percentiles reinforce the importance of defining a specific target score before you start preparing: the effort required to go from 1,200 to 1,400 is not the same as the effort required to pass 1,500.
How do universities use percentiles?
Universities do not publish just a minimum score – they publish the range of 25% to 75% of admitted students, known as the interquartile range. This is much more useful than the minimum.
If a college’s rank is 1,450-1,550 and your score is 1,460, you technically get in – but you’re in the bottom quartile of admits. Conversely, if you reach 1,550 or higher, you’re in the top quartile, which significantly strengthens your candidacy.
That’s why we recommend always aiming above the 75th percentile of your target university, not just the minimum.
Which percentile should I consult in my score report?
College Board publishes two types of percentiles in your score report and it is important not to confuse them:
- Nationally Representative Sample: compares you to all U.S. high school students, including those who never take the SAT. This percentile is usually higher and is not the relevant percentile for admissions.
- SAT User Percentile: compares you only to students who took the test. This is the percentile that colleges use to evaluate your candidacy.
When reviewing your score, be sure to always check the SAT User Percentile – it’s the only one that matters in the admissions process.
What is the SAT digital score report like?
The digital SAT score report shows your total score, the score for each section and your percentile – all in one document that you receive through your College Board account. In the report you will see two main elements: the arrows indicate the performance per section (score and percentile), and the central circle reflects your total score with its corresponding percentile. This is exactly what you will receive after taking the digital SAT.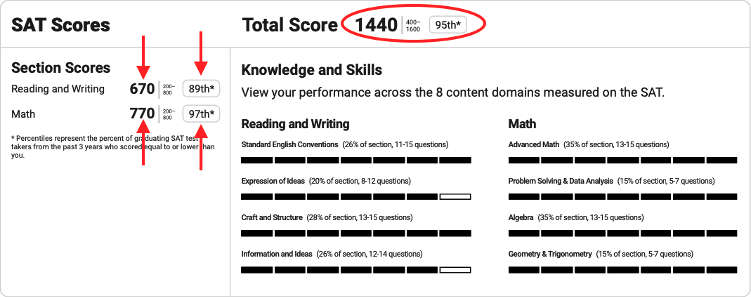
What SAT score do you need to study in Europe?
More European universities accept the SAT every year — not just as an alternative to local qualifications, but as a genuine differentiator in competitive admissions. Below is a country-by-country breakdown of the key institutions that accept SAT scores and what you realistically need to be competitive.
What SAT score do you need for German universities?
Germany has a growing number of English-taught programmes that accept the SAT as part of their admissions process. The following institutions are confirmed SAT-accepting as of 2026 per College Board official data:
- Bard College Berlin — liberal arts, holistic admissions
- Constructor University Bremen — STEM and social sciences
- Frankfurt School of Finance & Management — business and finance
- Lancaster University Leipzig — business and management
- WHU – Otto Beisheim School of Management — one of Germany’s most selective business schools
- Carl Benz School of Engineering (KIT) — part of Karlsruhe Institute of Technology
- Hochschule Furtwangen University — applied sciences and technology
None of these institutions publish a fixed SAT minimum — admissions are holistic and competitive. For the more selective programmes such as Frankfurt School and WHU, a score of 1,300 or above puts you in a stronger position. However, requirements and recommended scores vary significantly between institutions and programmes. We strongly recommend contacting each university directly to understand which programme best fits your profile and what score they consider competitive for your specific situation. For full details on SAT test centres and dates in Germany, see our complete guide to the SAT in Germany.
What SAT score do you need for Dutch universities?
The Netherlands has a strong tradition of English-taught bachelor programmes, and several top institutions accept the SAT for international applicants:
- University of Amsterdam (UvA)
- TU Delft
- Erasmus University Rotterdam
- VU Amsterdam
- Utrecht University
Requirements vary significantly by programme and faculty. Some accept from 1,200, while the most competitive programmes at UvA and Erasmus typically expect scores closer to 1,350 or above. We strongly recommend contacting each university and faculty directly to confirm their current requirements and understand which programme is the right fit for your profile, as requirements are updated annually. For full SAT information for students in the Netherlands, see our complete guide to the SAT in the Netherlands.
What SAT score do you need for Italian universities?
Italy’s most internationally recognised universities use the SAT as a primary admissions instrument for international applicants applying to English-taught programmes.
- Bocconi University (Milan) — one of Europe’s most competitive business schools. Admissions are ranking-based, combining your SAT score with your school GPA. The average SAT score among admitted students has historically been around 1,400. Scoring below 1,350 makes it very difficult to be competitive.
- LUISS Guido Carli (Rome) — accepts SAT for international applicants to its English-taught business and law programmes. A score around 1,250 is the realistic baseline to be considered.
- University of Bologna — one of the world’s oldest universities, accepts SAT for certain international programmes. Based on EPIC’s experience with students admitted over the years, a score around 1,300 puts you in a solid position.
- Politecnico di Milano — one of Europe’s leading technical universities. Accepts SAT with a minimum score of 1,240, requiring at least 620 on each section (Math and Reading & Writing).
- Politecnico di Torino — one of Italy’s top engineering institutions, accepts SAT as part of its international admissions process.
For more on studying in Italy and how to prepare, see our SAT Courses in Italy and Italian SAT preparation resources.
What SAT score do you need for Swiss universities?
Switzerland is home to some of the world’s highest-ranked universities. The SAT is accepted at several institutions, particularly for international or English-taught pathways:
- ETH Zurich — consistently ranked among the world’s top universities for science, technology and engineering
- EPFL (École Polytechnique Fédérale de Lausanne) — one of Europe’s leading technical universities
- University of Zurich — accepts SAT for international students applying to English-taught programmes
ETH Zurich and EPFL are two of the most demanding institutions in the world academically. While neither publishes a specific SAT minimum, the calibre of their admitted students means that only very strong scores will realistically be competitive. We strongly recommend contacting each institution directly before applying to understand their current requirements and process. EPIC Prep has offices in Zurich and has been preparing students across Switzerland since 2010 — contact our team and we can guide you.
What SAT score do you need for Spanish universities?
In Spain, the SAT is primarily used by students targeting international programmes at private institutions. Three institutions accept the SAT as part of their admissions process:
- IE University (Madrid and Segovia) — accepts SAT for its international bachelor programmes. A score around 1,250 is the realistic baseline to be considered competitive.
- ESADE Business School (Barcelona) — accepts SAT for its undergraduate programmes. The recommended score is around 1,300–1,350 to be a strong candidate.
- Saint Louis University Madrid (SLU-Madrid) — the Madrid campus of this US university accepts SAT as part of its standard admissions process. A score slightly above 1,150 is the general reference point.
For students in Spain preparing for the SAT to access these programs or US universities, our SAT preparation course in Spain and Spanish course resources cover the full exam with personalized coaching from our Madrid and Barcelona offices.
We hope this article has answered your questions. If you have any questions about your preparation, please contact us and we will be happy to explain how EPIC Prep can help you achieve your goals.